Agriculture Drove Recent Record-Breaking Tree Cover Loss
Article by World Resources Institute
Global tree cover loss reached record highs in 2016 and 2017. In 2018, roughly one soccer field of tree cover was lost every second. What drove this loss? Global data on the drivers of tree cover loss, developed by WRI and The Sustainability Consortium and updated this week on Global Forest Watch, can tell us.
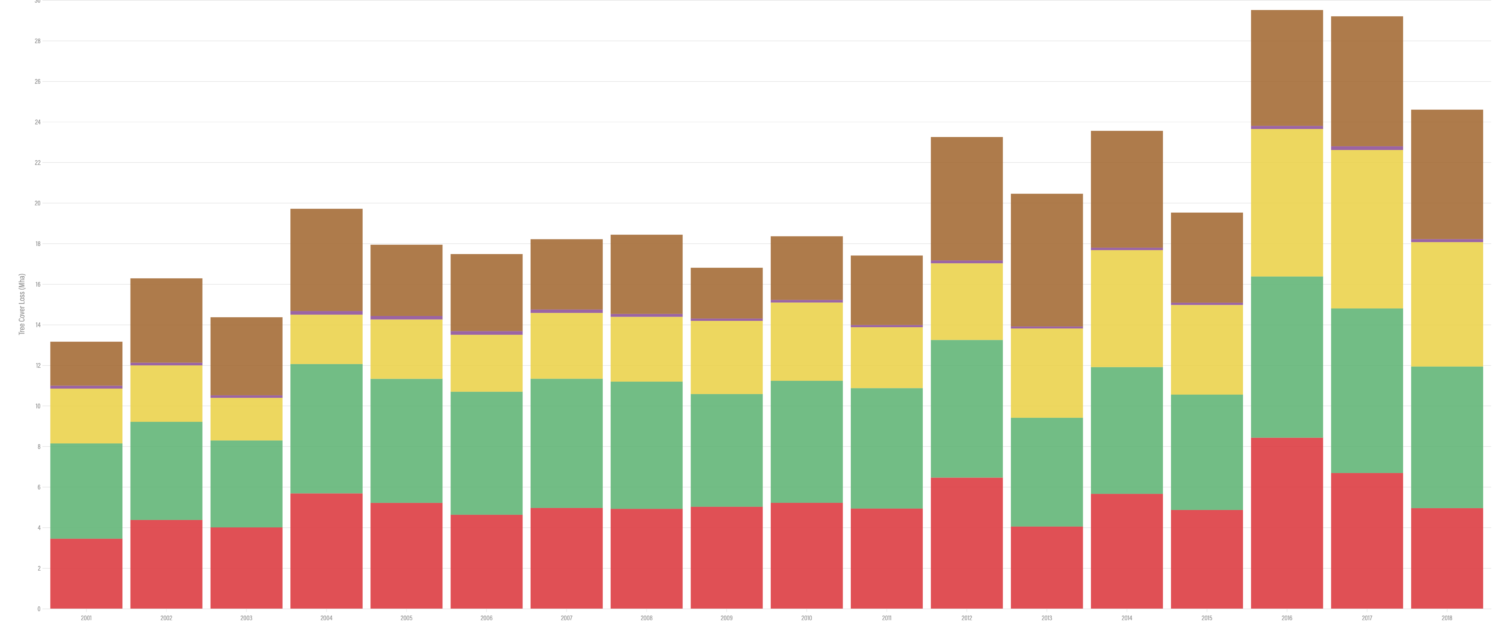
The original analysis, published in Science in 2018, applied a computer model to GFW’s annual tree cover loss data to determine the most likely drivers of loss based on thousands of high-resolution satellite images collected between 2001 and 2015. Nearly half of all loss was linked to agriculture, either through deforestation to make way for cattle grazing, oil palm plantations or other commercial commodities, or for smaller-scale farming and its expansion into forest areas.
An updated model incorporates tree cover loss data from 2016 to 2018 to help identify factors responsible for the sharp spike in loss since 2015.
What’s Changed in the Past Three Years?

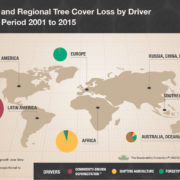
In terms of what’s driving loss overall, not much has changed. The relative proportions of the drivers don’t look much different on a global and regional level in recent years than they have in the past. In the northern hemisphere, most loss is due to a combination of forestry and wildfire and in the tropics, agriculture continues to push into the forest frontier. Deforestation for large-scale agricultural commodity production drives most loss in Latin America and Southeast Asia, whereas in Africa 94% of loss is a result of smaller scale shifting agriculture. For 98% of the world, these dominant drivers have remained unchanged, but looking closer at more specific locations gives a more nuanced picture. Here’s a deeper look at what the new data shows:
Colombia: new loss driven by expansion of large-scale agriculture
Tree cover loss in Colombia rose dramatically since 2015, with loss in 2018 more than 2.5 times the historical average between 2001 and 2015. The reason: a distinct wave of new commodity-driven deforestation, combined with expanding small-scale agriculture, is gobbling away at the primary forest frontier. The updated drivers model aligns with recent reports that deforestation for commodity production is underway along new frontiers— mainly related to illegal land grabbing for pastureland to raise beef cattle. Weekly deforestation alerts for 2019 and early 2020 pick up where GFW’s annual loss data end, showing continued deforestation into the northwest Colombian Amazon between Tinigua, La Macarena and Chiribiquete national parks; the western sector of the Chiribiquete park expansion zone; and the northwestern segment of Nukak National Natural Reserve.

Western North America: Surge in fire-driven loss
Across North America, wildfire was the dominant driver associated with more than 5.2 million hectares of tree cover loss between 2016 and 2018. California had two record breaking fire seasons in 2017 and 2018, leading to 144 deaths as well as extensive property damage in California wine country. The updated drivers model picked up the 2018 Mendocino Fire Complex, including the Ranch River fires, which caused massive tree cover loss north of San Francisco.
Meanwhile, in British Columbia, some areas classified by the original model as forestry “flipped” to wildfires in the update. During forest management, foresters often administer prescribed burns of the stumps and debris left on the forest floor after harvest. This is done to prepare the land for the next planting cycle. Since many of these areas occur within logging concessions, we presume these post-harvest practices caused the change from forestry to wildfire. In the next round of updates, the wildfire class will almost certainly pick up forests burned in the recent and dramatic Australian brushfires.
Thailand: Agriculture intensifies in the North
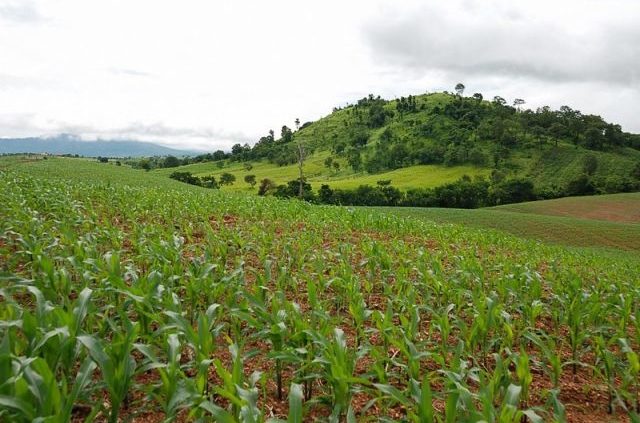
In many tropical regions, traditional shifting cultivation systems are the main form of agricultural production. Short cultivation periods of a diverse mix of crops are interspersed with longer phases of forest recovery and regeneration, which allow nutrients in the soil to replenish. Increasingly, these agricultural systems are being replaced by more intensive and permanent production of cash crops to feed hungry supply chains, and fallow periods of forest recovery are getting shorter. In the mountainous Chiang Mai region of Northern Thailand, more and more areas historically used for subsistence agriculture are transitioning to crops such as corn, which feeds the region’s growing livestock industry. This land use dynamic shows up as a shift from yellow shifting agriculture to red commodity-driven deforestation cells in the updated drivers model through 2018.

Moving Forward: Sharpening the Picture
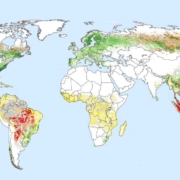
This model, although updated and refined, provides us with a relatively coarse understanding of what drives tree cover loss around the world. Each cell on the map is roughly the size of 10,000 soccer fields. Within each cell, multiple dynamics could be at play on a much finer scale.
In addition, there are more causes of tree cover loss than the five outlined in this model. As a result, certain drivers that weren’t included in the model, like hurricanes or other natural disasters, are mis-classified under the heading of shifting agriculture— as was the case in Puerto Rico after Hurricane Maria in 2018. The two wildfire examples above also show that the model cannot distinguish between human-caused vs. truly “wild” wildfires. Local knowledge is required to understand the detailed complexity of reality.
Regardless, thematic maps like the one generated by the drivers model can paint a broad picture of the global patterns of forest loss and draw attention to different areas that need different types of interventions. The drivers data is already being utilized by The Sustainability Consortium’s Commodity Mapping Platform to help companies understand the impacts of their global supply chains. As new techniques in computer vision and artificial intelligence develop, we will refine the model and advance our understanding not just of where forests are falling, but why.

 The Sustainability Consortium® | ©2018 Arizona State University and University of Arkansas

 The Sustainability Consortium® | ©2018 Arizona State University and University of Arkansas