Coffee Supply Chain Diagram
| Author(s): | The Sustainability Consortium |
| Date Published: | September 29, 2017 |
| Projects: | Sustainable Coffee Challenge; Coffee Product Sustainability Toolkit |
| Number of Downloads | 6627 |
| Size | 379.27 KB |
| File | Action |
|---|---|
| Coffee Supply Chain Diagram | Download |
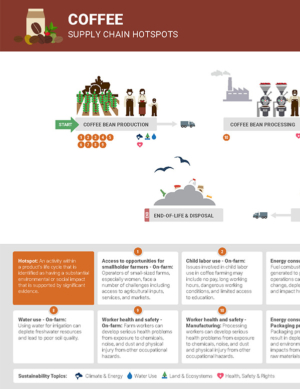
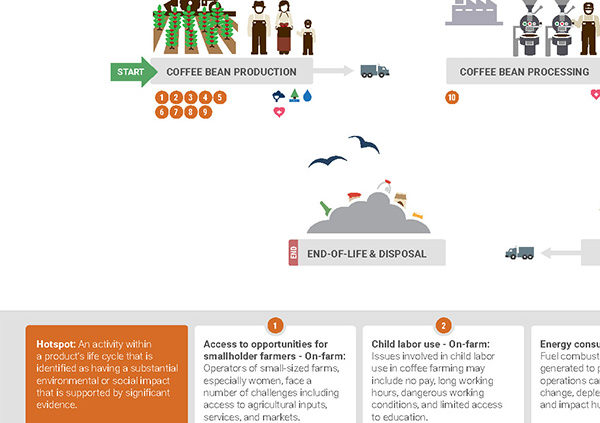
The Supply Chain Diagrams produced by The Sustainability Consortium are used to visualize the hotspots along a product category life cycle. In addition, it shows key performance indicators that are used to assess and track performance toward addressing key sustainability issues for that category. KPIs can be used to measure progress against the hotspots.
The Sustainable Coffee Challenge was formed “to make coffee the first sustainable agricultural product in the world”. The Sustainability Consortium (TSC) is a proud member of the Sustainable Coffee Challenge, which is being led by one of TSC’s key partners, Conservation International. As part of our commitment to the Challenge, TSC is releasing, along with this report, its “toolkit” of products in the Coffee category into the public domain. In doing so, we encourage commercial and non-profit organizations throughout the coffee supply chain to use these tools to learn more about hotspots and improvement opportunities in the coffee supply chain, use the KPIs to measure and share progress around key issues, and use the research reports as a basis for raising awareness and focusing action. One of these tools includes the Coffee Supply Chain Diagram.



 The Sustainability Consortium® | ©2018 Arizona State University and University of Arkansas