TSC Impact Report 2019
Welcome from TSC Chief Executive
This year is TSC’s 10th birthday and it has been fantastic to celebrate 10 years of impact at scale. Our Impact Report has a new format this year, helping to highlight some of our major achievements. More clearly than ever, we are able to show which industries are solving sustainability, which issues aren’t seeing the required improvements, and where organizations are doubling-down to boost transparency and sustainability in the future. We now have three years of comparable data. We are seeing a remarkable increase in results from companies who have engaged in the Index over multiple years. Yes, there’s “low-hanging fruit”, but there are also huge rewards for companies willing to be ambitious and to commit for the long haul.
I hope you will be surprised with the impact results in this report. As always, our members are our driving force and the ones that, through TSC, keep entire industries accountable for how their actions affect people and the planet. As TSC celebrates 10 years this year, I can’t help but be proud of the progress we’ve made and the promise of a more sustainable future.

Euan Murray
Chief Executive
The Sustainability Consortium
Companies are increasingly taking action by setting science-based targets and committing to make products more sustainable. Over the last decade TSC has made tremendous strides in increasing transparency, which is essential for meeting these goals, and in proving how progress grows rapidly once companies decide to measure the impact of their supply chains. TSC has also emerged as the fundamental tool in driving and unlocking transparency not just for product categories, helping change companies and entire industries. In this impact report, I’m excited to see a 30% improvement in transparency scores for over 1,000 products, but it’s not enough. We need to scale up and accelerate transparency and sustainability at the product level to drive transformational change. EDF is proud to continue to support TSC in its efforts to do just that, and to make sustainability part of business as usual.

Elizabeth Sturcken
Managing Director
EDF+Business, EDF
Executive Summary
Four Years of Sustainability Index, 30% Improvement
The launch of THESIS celebrates four years of implementation of the THESIS Index*. Over a dozen organizations have used the Index, including Walmart, Amazon, Kroger, and Sprouts. These retailers represent over $200B in annual direct revenue, and perhaps close to $1 Trillion in overall reach.
On a 100-point scale, the 1446 consumer product manufacturers who participated in the 2018 THESIS Index* scored an average of 44.8. This represents a 30.5% improvement from the baseline year of 2016, when the average score was 34.3. In 2017 the average score was 38.6, so a linear improvement trend is emerging.
These increased Index scores largely represent increased transparency that product manufacturers have into their own global operations and increasing transparency into sustainability issues elsewhere in their value chain: product use, intermediate manufacturing, on-farm activities, and activities in fisheries and aquaculture. There is still significant room to improve however with supplier transparency around deforestation, transportation, product packaging, and product end-of-life and disposal.
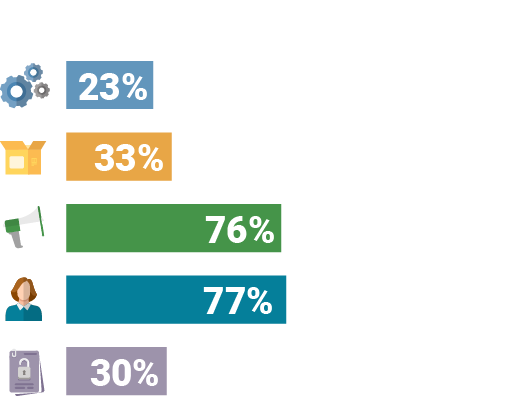
For the third year in a row, a vast majority of product manufacturers who participated in the THESIS Index* reported that they made changes to products, packaging, internal or supply chain practices in order to improve their Index score. Of the 86% who reported making changes, 23% changed processes, 30% changed product or packaging design, 76% improved internal communication, 77% engaged suppliers, and 30% made more public disclosures.

Kevin Dooley
Chief Scientist
The Sustainability Consortium
THESIS Index
*In 2019, the Sustainability Index became TSC’s THESIS Index. Learn more about THESIS here.
THESIS Index* Has Its Fourth Birthday
THESIS Index, originally known as The Sustainability Index, first launched in 2015. Over 2800 product manufacturers have participated in the Index since then. Almost 1500 manufacturers participated in 2018, and over 1000 have participated in each of the last three years.
Product Manufacturers Improve THESIS Index* Scores by Over 30% Since 2016
On a 100-point scale, the 1446 consumer product manufacturers who participated in the 2018 THESIS Index* scored an average of 44.8. This represents a 30.5% improvement from the baseline year of 2016, when the average score was 34.3. In 2017 the average score was 38.6, so a linear improvement trend is emerging.
Index Participating Companies Show Continuous Improvement
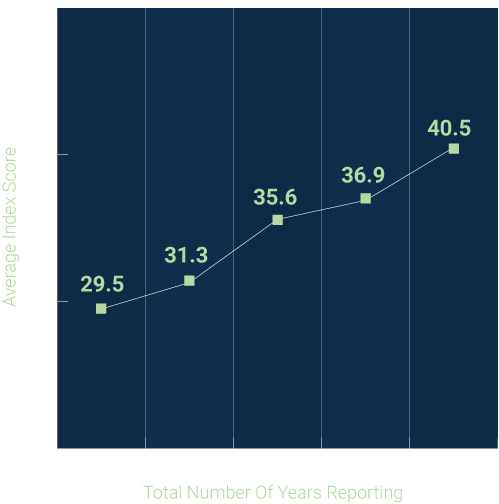
According to data from the 2018 THESIS Index*, product manufacturers who have engaged in the Index for a longer period of time have a correspondingly higher average score on their KPIs, indicating increasing transparency and impact measurement. Those who have reported in each of the last five years have a 37% higher score than those that have reported for just one year. This infers that when reporting to the Index, companies take specific actions, such as designing data collection systems or surveying their suppliers, that give them increased transparency over time.

Hotspot Hotshots
Some Value Chain Activities More Transparent Than Others
According to data from the 2018 THESIS Index*, product manufacturers have good transparency into their own global operations and increasing transparency into sustainability issues elsewhere in the value chain: product use, intermediate manufacturing, on-farm activities, and activities in fisheries and aquaculture.
Supply chain transparency is lower though concerning supplier activities around deforestation and transportation, product packaging, and product end-of-life and disposal.

Increased transparency in Intermediate Manufacturing.
Increased transparency in On-farm Activities.
Lower transparency around Deforestation
Lower transparency around Transportation.
Lower transparency around Product Packaging.
Lower transparency around End-of-Life and Disposal.
Increased transparency in Product Use.
Product Category Stories
Categories with Continuous Improvement
The old saying is, “three years makes a trend”. These product categories have had a consistent set of suppliers make improvements in the KPI scores from 2016 to 2017, and 2017 to 2018, and had a least a 10% improvement in overall score: Antifreeze, Apparel and Home Textiles, Automotive Oil, Disposable Wipes, Electronic Peripherals, Juice, Oral Care Products, Paint, Pharmaceutical Products, Pork, Soup and Convenience Meals, Stationary and Paper Supplies, and Video Game Consoles.
Pineapple Has Highest Average on THESIS Index
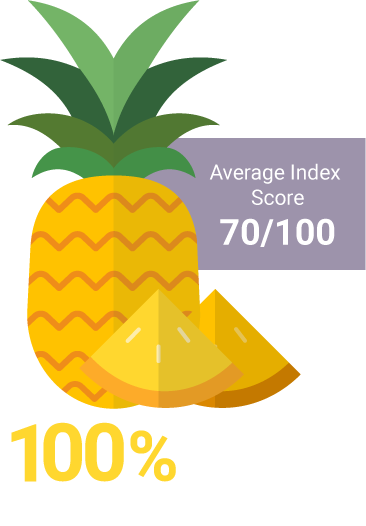
Manufacturers of pineapples have a lot to be proud of – their category surpassed all others in having the highest average Sustainability Index score (70/100). Their high average score is driven by these manufacturers having 100% visibility into key issues in their supply chain: fertilizer application, pesticide application, food waste, irrigation water use, child labor, labor rights, worker health and safety, and yield.
THESIS KPIs track and measure environmental and social issues relevant to a product category and help drive improvement
Fertilizer Application – Growing Operations
What was the nitrogen use intensity and phosphorus surplus associated with fertilizer application at the growing operations where your crops were produced?
Apparel and Home Textiles Products Making Big Jumps in Sustainability
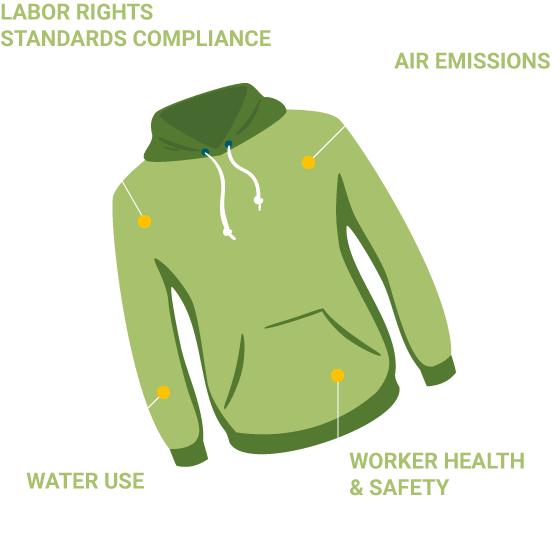
Data from THESIS Index shows that apparel and home textile products have made very significant strides in sustainability over the last three years. With over 500 suppliers participating, the clothing category manufacturers have increased their average score, on a 100-point scale, from 37 in 2016, to 42 in 2017, to 51 in 2018. Much of the increase in scores is due to greater supply chain transparency. For example, supply chain transparency into water use has increased 33% from 2016 to 2018, and transparency into supply chain worker health and safety has increased 30% over that time span. Likewise, clothing manufacturers are establishing environmental measurement systems in their own manufacturing facilities. Transparency around factory air emissions has improved 56% from 2016 to 2018, and compliance with a labor rights standard has increased 15%.
Along with greater transparency, apparel and textile manufacturers are reporting lower greenhouse gas emissions intensity for their manufacturing activities. The average kilograms of CO2 emissions per metric tonne of product has decreased by 22% from 2016 to 2018.
THESIS KPIs track and measure environmental and social issues relevant to a product category and help drive improvement
Worker Health and Safety – Supply Chain
What are the outcomes of your verifiable worker health and safety risk assessments performed on facilities that produced fabric used in your final product?
Pork and Chicken Industries Make Significant Strides in Measuring On-farm Performance
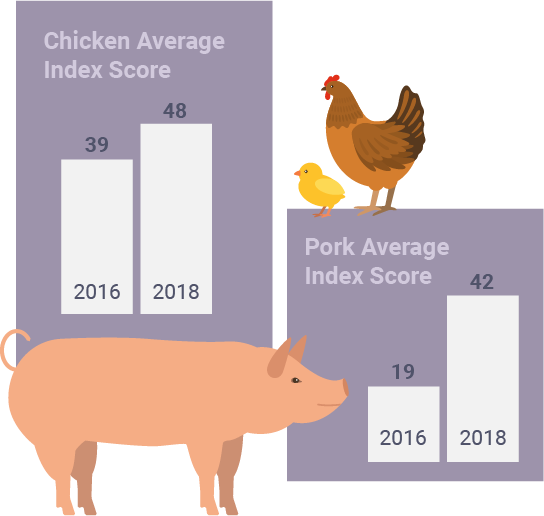
According to data from THESIS Index, the pork and chicken industries have significantly improved their scores on measuring environmental and social impacts at the farm level. From 2016, the pork manufacturers have improved their score from 19 to 42, on a 100-point scale. In that same time frame, chicken manufacturers have improved their score from 39 to 48. For the pork manufacturers, they got particular high KPI scores on questions concerning animal welfare certification, labor rights in farm operations, and worker health and safety in processing. Chicken manufacturers scored highly in KPIs concerning animal welfare certification, worker health and safety on the farm, and tracking of antibiotic use.
THESIS KPIs track and measure environmental and social issues relevant to a product category and help drive improvement
Animal Welfare Certifications and Audits
What percentage of your pork supply, by mass, was covered by a current comprehensive animal welfare certification or by verifiable, regularly conducted animal welfare audits at each of the following supply chain stages?
Antifreeze Products Make Largest Gain in Supply Chain Transparency
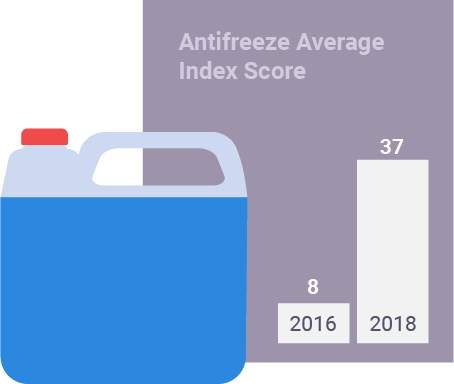
Manufacturers of antifreeze products have made the largest gains of any product category between 2016 and 2018 in TSC’s THESIS Index*. In 2016, with a score of 8 on a 100-point scale, manufacturers did not have the data requested by the Index, mostly responding “unable to determine at this time” to questions about manufacturing and supply chain performance. By 2018 the average score had increased over four-fold, to 37. This is a good demonstration of how the Index KPIs help drive the design and implementation of environmental and social responsibility measurement systems. The manufacturers in the category have particular higher scores on the management of priority chemicals in their products.
2016, programs with goals to reduce, eliminate, or restrict the use of priority chemicals using various tools and protocols did not exist for reporting manufacturers. By 2018, all manufacturers that responded have these programs, goals, and tools in place for managing priority chemicals.
THESIS KPIs track and measure environmental and social issues relevant to a product category and help drive improvement
Priority chemicals management
What is your organization’s approach to managing priority chemicals in your products?
Crop Supply Mapping Becomes Standard in Specialty Produce Products
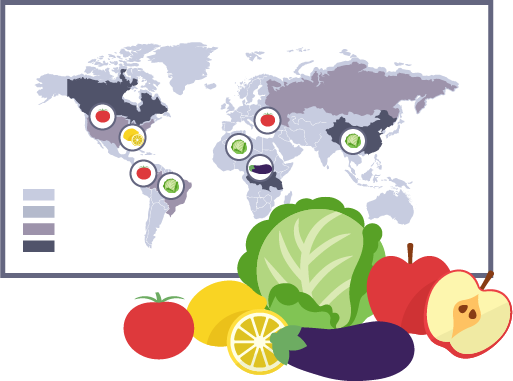
According to the 2018 Sustainability Index, manufacturers of specialty produce products have widely adopted crop supply mapping techniques in order to understand where their supply is coming from and what risks it might face. On a 100-point scale, manufacturers in these categories scored 85 or above concerning the practice of crop supply mapping in 2018: Apples and pears; berries and grapes; citrus; cucumbers, melons, and squash; lettuce and leaf vegetables; nuts and seeds; stone fruit; tomatoes, peppers, and eggplant. These higher scores are linked to specialty products having shorter, more local, and more communicative supply chains than commodity food goods or complex food products. It may also be influenced by traceability regulations in growing countries.
THESIS KPIs track and measure environmental and social issues relevant to a product category and help drive improvement
Crop supply mapping
For what percentage of your crop supply can you identify the country, region, or farm of origin?
Packaging Raw Material Sourcing
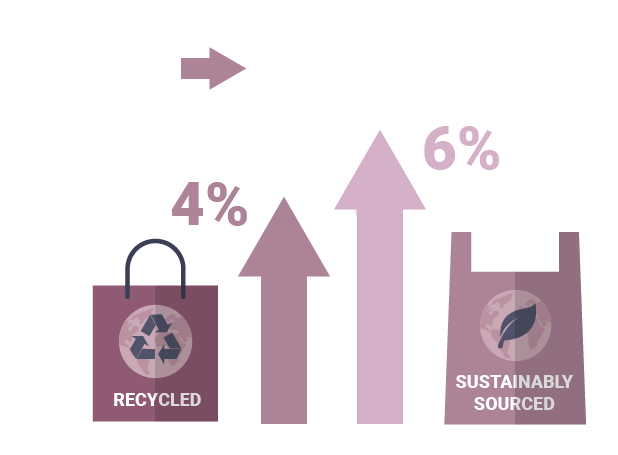
Across 47 product categories, the average percent of post-consumer recycled (PCR) material in product packaging increased by 4%, and the average percent of sustainably-sourced renewable virgin material increased by 6% from 2017 to 2018. This data aligns with the observation that numerous companies have been making public commitments around sustainable packaging, e.g. New Plastic Economy Global Commitment.
Over 60 Club
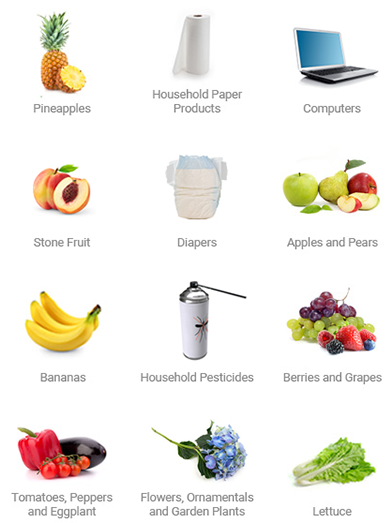
For a third year TSC is happy to announce the category winners of the “Over 60 Club” – those product categories whose manufacturers scored, on average, 60 or over (out of 100) on their Sustainability Index scorecard. This year’s top scoring categories who had five or more participating manufacturers, from highest downward, are: Pineapples; Household Paper Products; Computers; Stone Fruit; Diapers; Apples and Pears; Bananas; Household Pesticides; Berries and Grapes; Tomatoes, Peppers, and Eggplant; Flowers, Ornamentals, and Garden Plants; and Lettuce.
There are several reasons for why these categories may have higher scores, largely reflecting great supply chain transparency. Categories with fewer suppliers tend to consist of suppliers that are larger, and therefore have more resources to have more supply chain visibility. That said, there are categories with the same number of suppliers but very different category averages, so there must be other reasons for those differences. Supply chain distance (spatial and structural), relational distance (willingness to share data), and existing regulations, certifications, and traceability infrastructure can all be reasons why supply chain transparency is relatively high or low. For example, many countries, including US and EU, have regulations regarding traceability of specialty crops like fruits and vegetables.
Active Projects
The Fate of Food in the DSD System
Northwest Arkansas Circular Economy Development
WearEver
Beauty & Personal Care Product Sustainability Rating System
TSC Impact Reports
2018 Transparent Supply Chains for Better Business
Visit Webpage | Download PDF
2017 The Call For Collective Actions Across Supply Chains
Visit Webpage | Download PDF
2016 Greening Global Supply Chains: From Blind Spots to Hotspots to Action
Download PDF
Sustainable Products for a Sustainable Planet
Help us build a world where sustainable products are our every day products. Your support can make this vision a reality. Donate today.
