CASE STUDIES
The need for industry to reduce GHG emissions is acute. In their recent report, “Global Warming of 1.5 °C”, IPCC scientists warn of the dire consequences on natural and human systems should global warming reach the 1.5 mark.
Under the U.N. Paris agreements which begin in 2020, 196 countries have committed to emissions reduction targets aligned with maintaining no more than a 1.5-degree temperature increase. In turn, many companies, and almost all large companies, have adopted GHG emissions reduction goals.
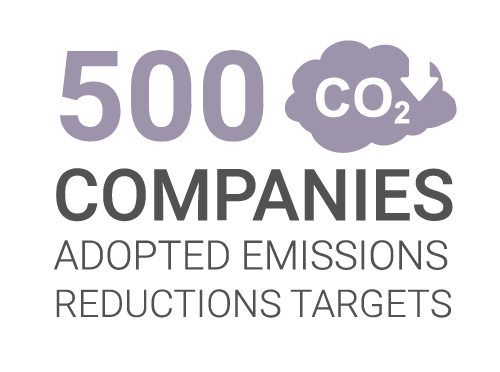
Almost 500 companies have adopted the science-based target (SBT) methodology. SBT provides a systematic way for an organization to determine their emissions reductions targets in alignment with the global temperature increase goal.
Data from the Sustainability Index in the Clothing, Footwear, and Textiles product categories suggests that many companies in the sector have improved their GHG emissions performance.
- More textile companies are measuring GHG.
- Textile companies are gaining increased transparency into their suppliers’ GHG emissions.
- Textile companies that have participated in the Sustainability Index for 3 years tend to have more visibility into their own and their suppliers’ GHG performance than those who have participated only 1 or 2 years.
More companies measuring GHG
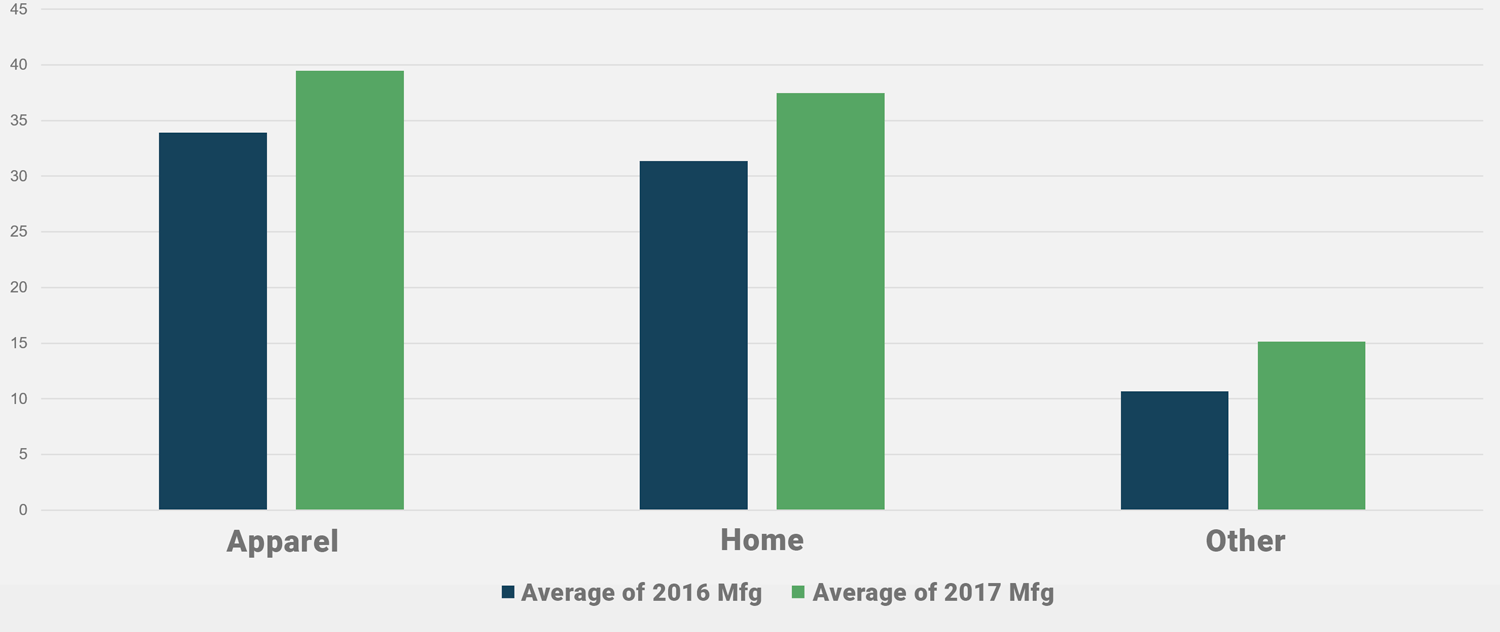
Figure 1 shows the average KPI score of the KPI that measures GHG emissions intensity in manufacturing operations. A higher score means that more manufacturers are measuring their own GHG emissions.
The data is further segregated into three categories: apparel (including footwear), home textiles, and other textiles (e.g. sporting goods, travel). In the apparel categories, measurement of GHG improved from 34% to 39%; in home textile categories, from 32 to 37%; and in other textile categories, from 11% to 15%, between 2016 and 2017.
Transparency of Greenhouse Gas Emissions Intensity – Manufacturing
(Suppliers Reporting 2016-17)
Figure 1 – This KPI changed between 2015 and 2016 in a way the precludes comparison
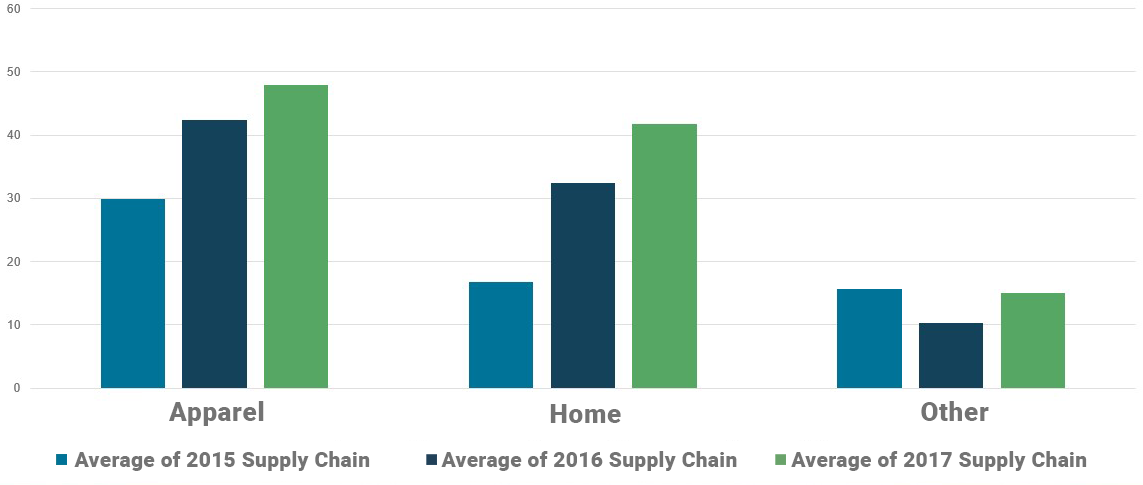
Greenhouse Gas Emissions – Supply Chain (Suppliers Reporting 2015-17)
Figure 2
Gaining increased transparency
into supply chain
Figure 2 shows the average score of the KPI that measures GHG emissions intensity in supplier operations. Data is shown over 3 years, from 2015 to 2017. A higher score means that more manufacturers have transparency into their suppliers’ GHG emissions.
In the apparel categories, supply chain transparency improved from 30 to 42 to 48%; in home textile categories, from 17 to 31 to 34%; and in other textile categories, from 15 to 10 to 15%, between 2015 and 2017.
Participation Matters
The Sustainability Index strengthens market signals to establish need and opportunity for textile manufacturers to measure and report their GHG emissions performance. Since it often takes a year or two to develop the necessary measurement and reporting systems to account for GHG emissions, we would expect textile companies that have received that market signal for a longer period of time would be farther along in their performance, and the data supports this.
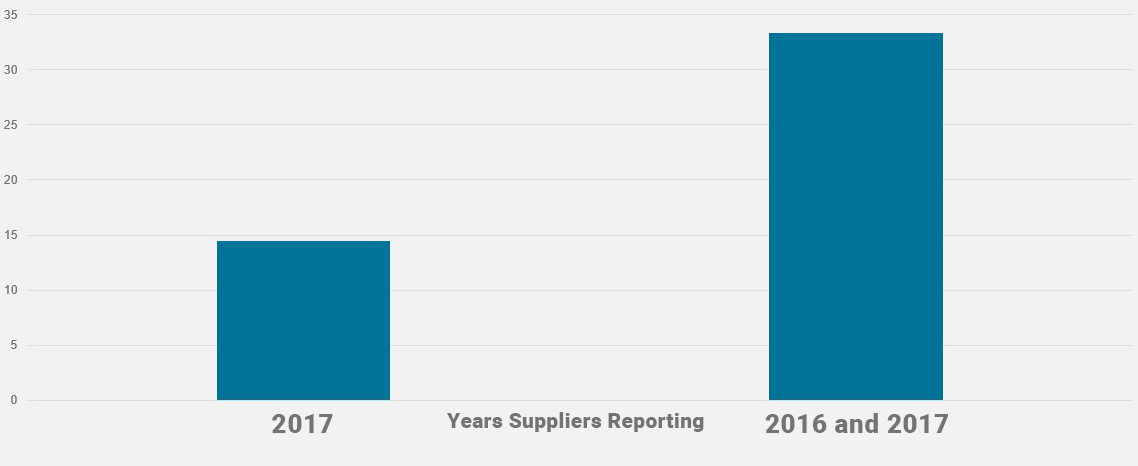
Figure 3 shows the average KPI score of the KPI that measures GHG emissions intensity in manufacturing operations. Those who participated for the first time had an average score of 15%, while those that had participated in both 2016 and 2017 had an average score of 33%.
Greenhouse Gas Emissions Intensity – Manufacturing 2017 Average Score
Figure 3 – This KPI changed between 2015 and 2016 in a way the precludes comparison
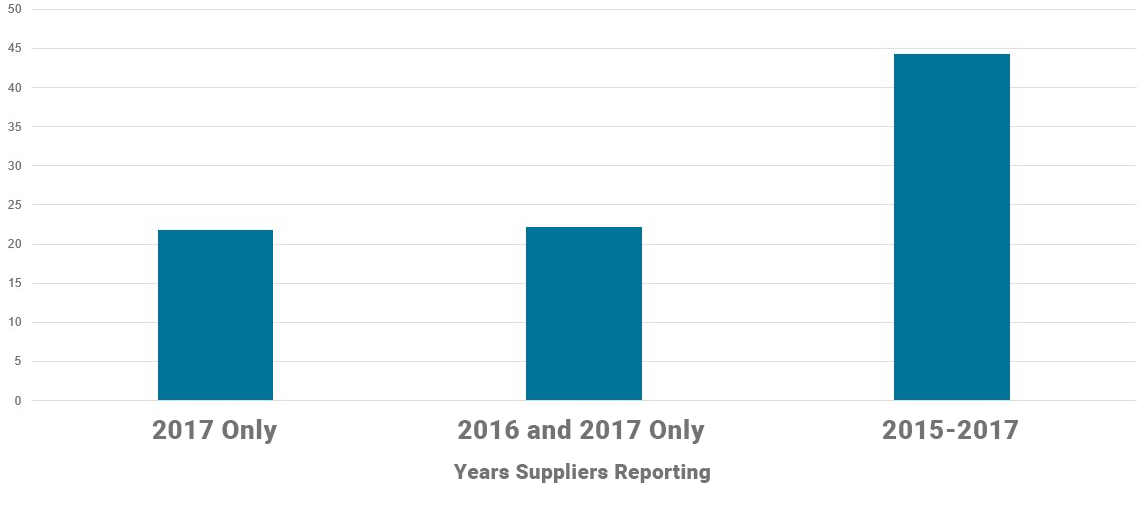
Greenhouse Gas Emissions – Supply Chain 2017 Average Score
Figure 4
Figure 4 shows the average KPI score of the KPI that measures GHG emissions intensity in supplier operations. Those who participated for the first time had an average score of 22%; those that had participated in both 2016 and 2017 had an average score of 23%; and those that had participated all three years had a score of 44%, double that of the first-timers.
In summary, clothing, footwear, and textile manufacturers are contributing positively to our global goals around reducing GHG emissions intensity. Market signals from downstream customers help drive increased measurement and reporting of corporate and supply chain GHG emissions. Textile companies and their suppliers are also using tools like the Sustainable Apparel Coalition’s Higg Index and CDP’s Climate Questionnaire to collect facility and organizational GHG data. The statistics shared here indicate it is increasingly typical for a company to have insight into its GHG emissions. If the trend continues, manufacturers could be at a disadvantage when such information is not available.
