PROJECTS
The following tools are now publicly available and free for use and distribution:
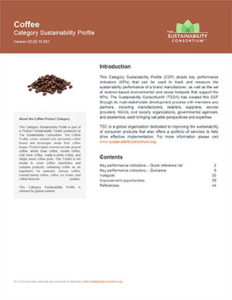
Coffee CSP and KPIs
The Coffee Category Sustainability Profile (CSP) identifies the environmental and social hotspots and improvement opportunities across the coffee supply chain. The Coffee Key Performance Indicators (KPIs) can be used to measure progress against the hotspots.
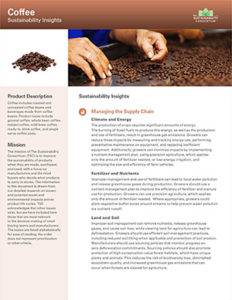
Coffee Sustainability Insights
The Coffee Sustainability Insights summarizes the Profile into a one-page, easy-to-understand document aimed at retail merchants and brand sales teams.
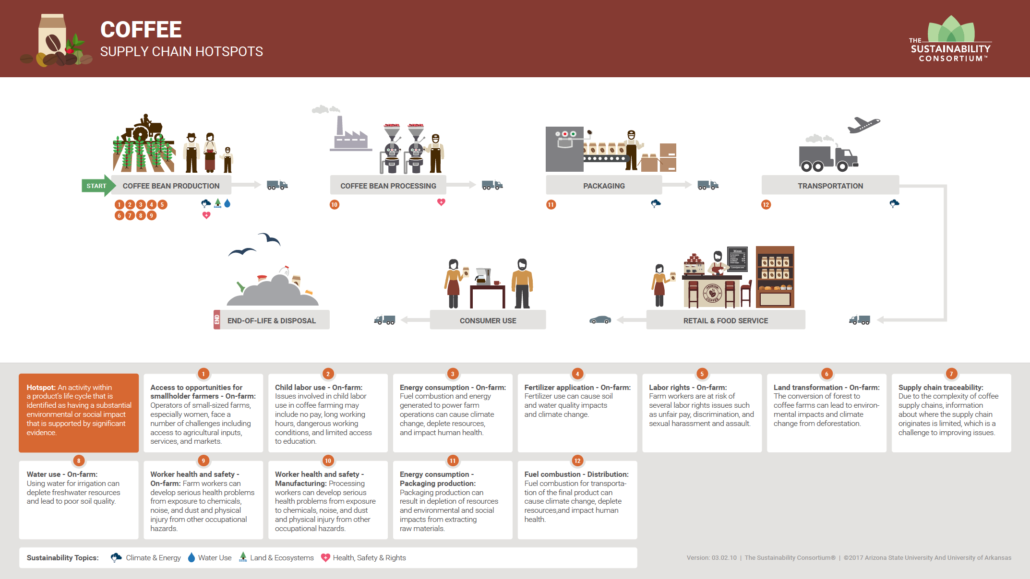
Coffee Supply Chain Diagram
The Coffee Supply Chain Diagram provides a visual summary of the Profile, and is an excellent tool to use for raising awareness of where particular hotspots are in the product life cycle.
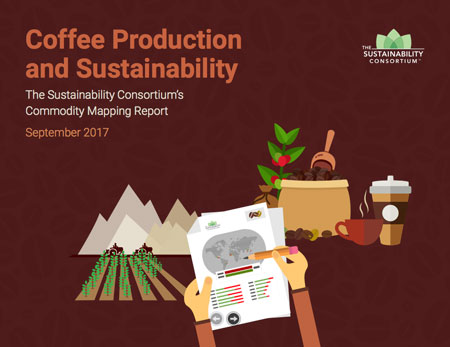
Coffee Commodity Mapping Report
The Coffee Commodity Mapping Report demonstrates TSC’s commodity mapping services, which helps downstream buyers learn more about where they are sourcing from, and what risks there might be in those regions.
Coffee Survey Data
In 2016, 44 coffee manufacturers (brands and producers) responded to TSC’s sustainability surveys as requested by Walmart, Sam’s Club, and other retailers. The survey consists of 14 questions, or key performance indicators (KPIs), that the coffee manufacturers responded to. The table below shows the performance of the 44 manufacturers, for the 14 KPIs, in two different ways: the percentage of manufacturers who had a 90% or higher score on the KPI, and the percentage of manufacturers who had a 0% score on the KPI.
| Key Performance Indicators | Percent With 90% or Greater Score | Percent With 0% Score | |
|---|---|---|---|
| Environmental Issues – On-farm | Deforestation and Land Conversion – On-farm | 9% | 48% |
| Fertilizer Application – On-farmDeforestation | 2% | 89% | |
| Greenhouse Gas Emissions Intensity – On-farm | 7% | 91% | |
| Irrigation Water Use Intensity – On-farm | 7% | 84% | |
| Irrigation Water Use Intensity – On-farm | 23% | 66% | |
| Social Issues – On-farm | Access to Opportunities for Smallholder Farmers | 16% | 25% |
| Child Labor Use – On-farm | 32% | 52% | |
| Labor Rights – On-farm | 20% | 61% | |
| Worker Health and Safety – On-farm | 20% | 64% | |
| Supply Chain Visibility | Crop Supply Mapping | 93% | 0% |
| Environmental Issues – Processing | Transportation to Retailers | 16% | 73% |
| Social Issues – Processing | Worker Health and Safety – Processing | 66% | 27% |
| Packaging | Packaging Raw Material Sourcing and End-of-Life | 0% | 50% |
| Sustainable Packaging Design and Production | 0% | 50% |
In general, a 100% score on a KPI corresponds to the manufacturer’s ability to provide a measure that represents 100% of their operations, or their supply chain operations. Conversely, a 0% score represents that the manufacturer is unable to determine any measure of performance for any of their operations or supply chain. For example, only 9% of coffee manufacturers have 90% visibility or higher as to whether their supply chain is free of deforestation and land-use risks. Conversely, 48% of coffee manufacturers have no visibility into risk.
There are two patterns in the scores that are similar to what can be seen in other categories. First, scores on KPIs related to social issues tend to score higher than those related to environmental issues. A coffee manufacturer was 50% more likely to say they were “unable to determine” an environmental KPI than a social KPI. We attribute this to their being greater attention, for a longer period of time, to social versus environmental issues, especially on the coffee farm itself. Second, scores tend to decrease the farther away the hotspot is from the manufacturer. In this case, lack of traceability and difficulties in sharing data across multiple tiers of a supply chain get in the way of coffee manufacturers being able to know the risks in their supply chain.
It appears that almost all coffee manufacturers have worked hard to improve traceability. 93% of manufacturers are able to trace 90% or more of their coffee supply, to the country. Performance on the packaging related KPIs was not as strong. No manufacturers scored 90% or above on the two packaging KPIs, and 50% of manufacturers were unable to determine a response about packaging materials, or did not take sustainability into account during packaging design.
Our Commitment
TSC has joined forces with dozens of other corporations, NGOs, and service providers, including TSC members Ahold, IDH, and Conservation International, to be a part of the Sustainable Coffee Challenge. The goal of the Challenge is for participant organizations to make sustainability-related commitments, with the vision of making coffee a completely sustainable crop. Conservation International serves as the Secretariat for the Challenge.
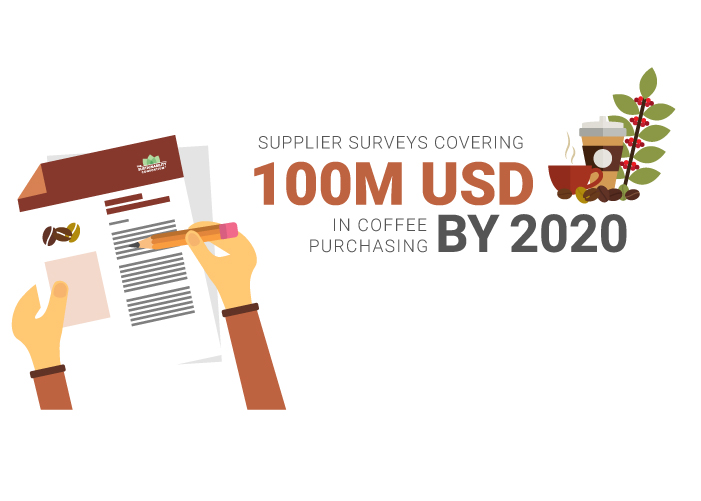
TSC’s commitment is “By 2020, The Sustainability Consortium (TSC) will be supporting global retailers in the deployment of supplier surveys covering 100M USD in coffee purchasing, thus sending a strong market signal for sustainable coffee. To facilitate this, TSC has released its coffee supplier survey and other components of its coffee toolkit into the public domain.”
This goal is a natural extension of our more general goal around TSC metric adoption. In addition to this goal, we would like to explore other ways in which our members, and other participants in the Challenge, could interact to improve the coffee supply chain. For those interested, please contact Kevin Dooley.
Get involved in the Sustainable Coffee Challenge!
Kevin Dooley
Chief Scientist
The Sustainability Consortium
kevin.dooley@sustainabilityconsortium.org
